Here at the Daily Dot, we swap GIF images every morning. Now we’re looping you in. In the Morning GIF, we feature a popular—or just plain cool—GIF we found on Reddit, Canvas, or elsewhere on the Internet.
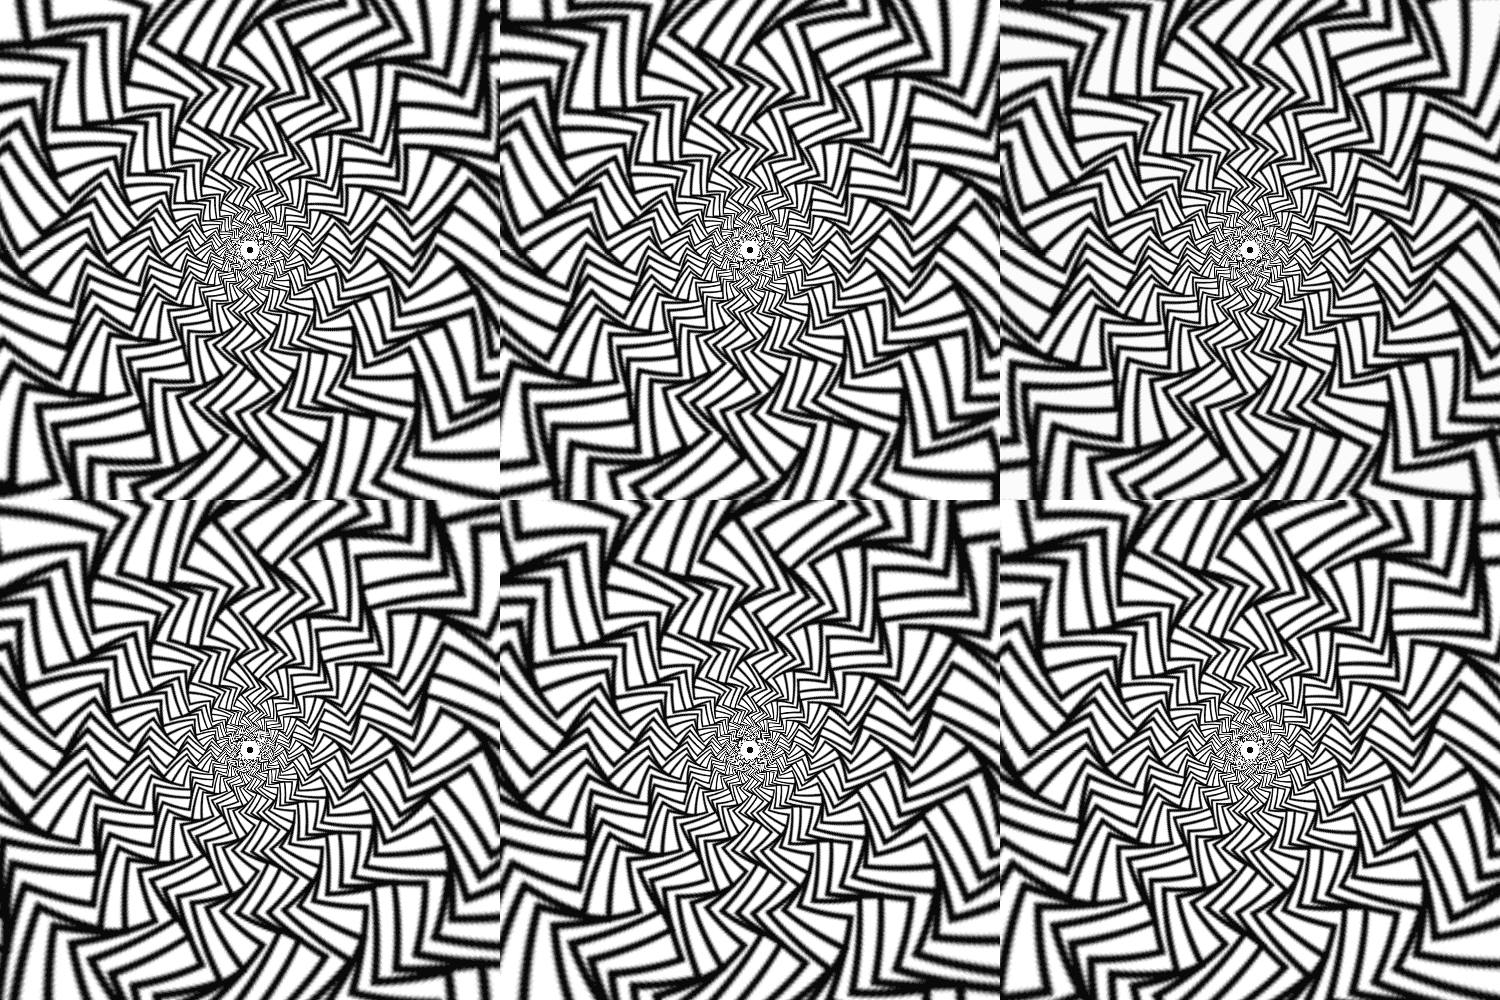
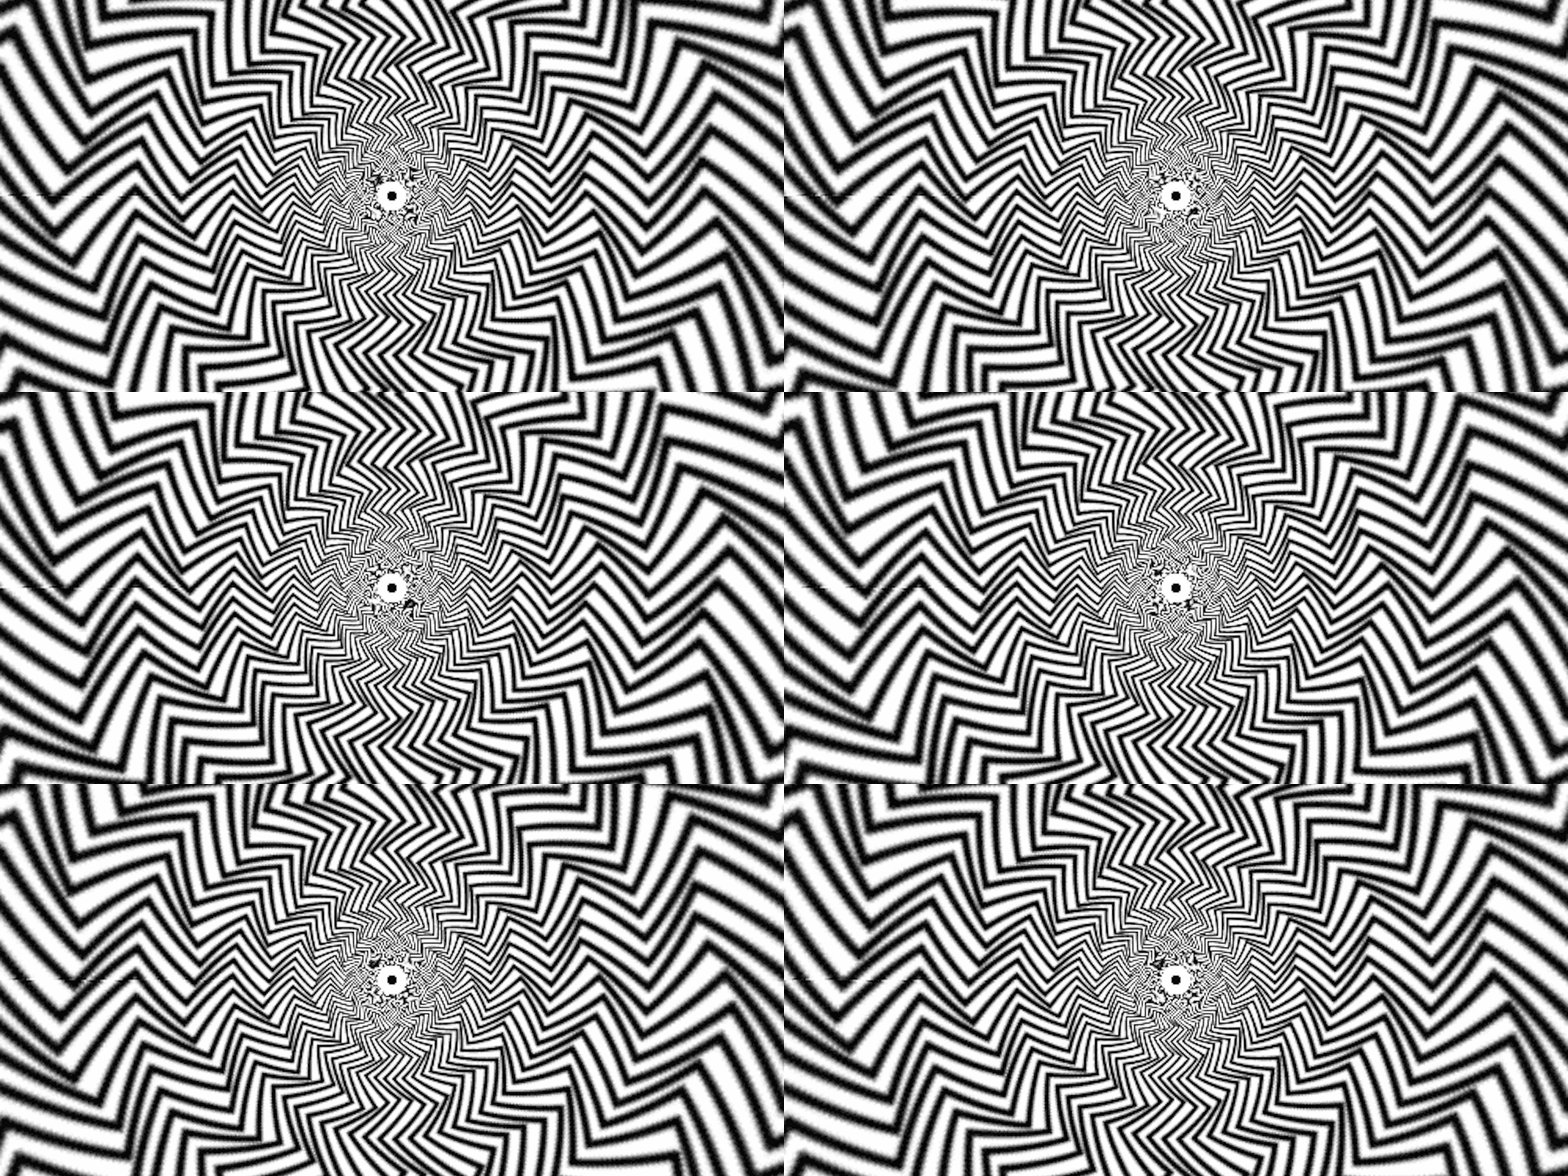
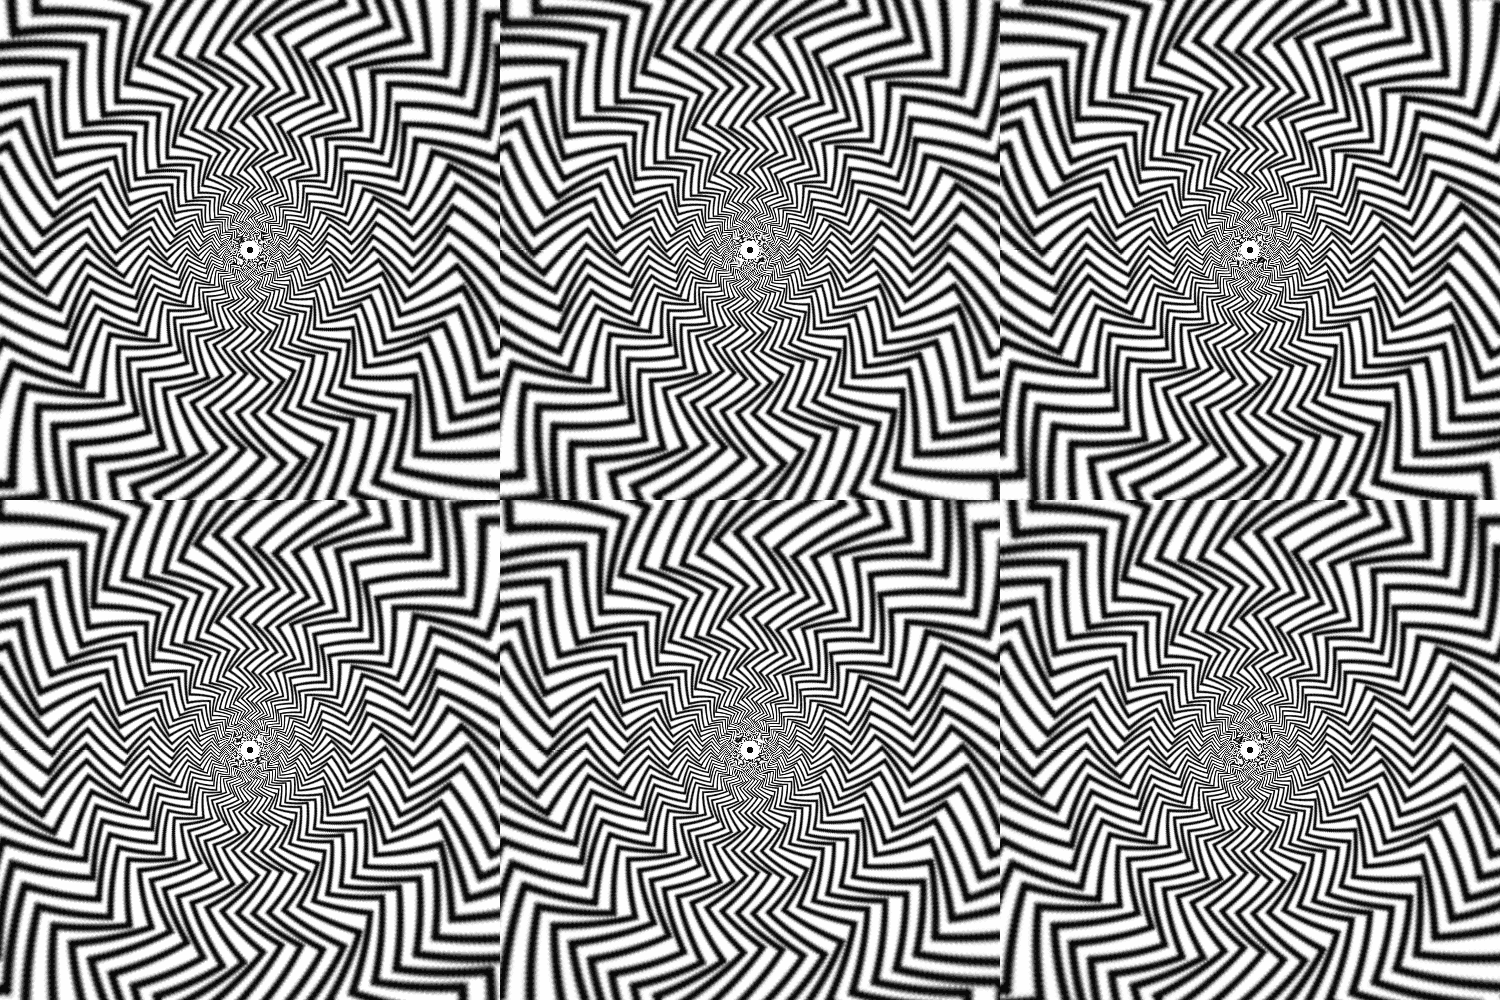
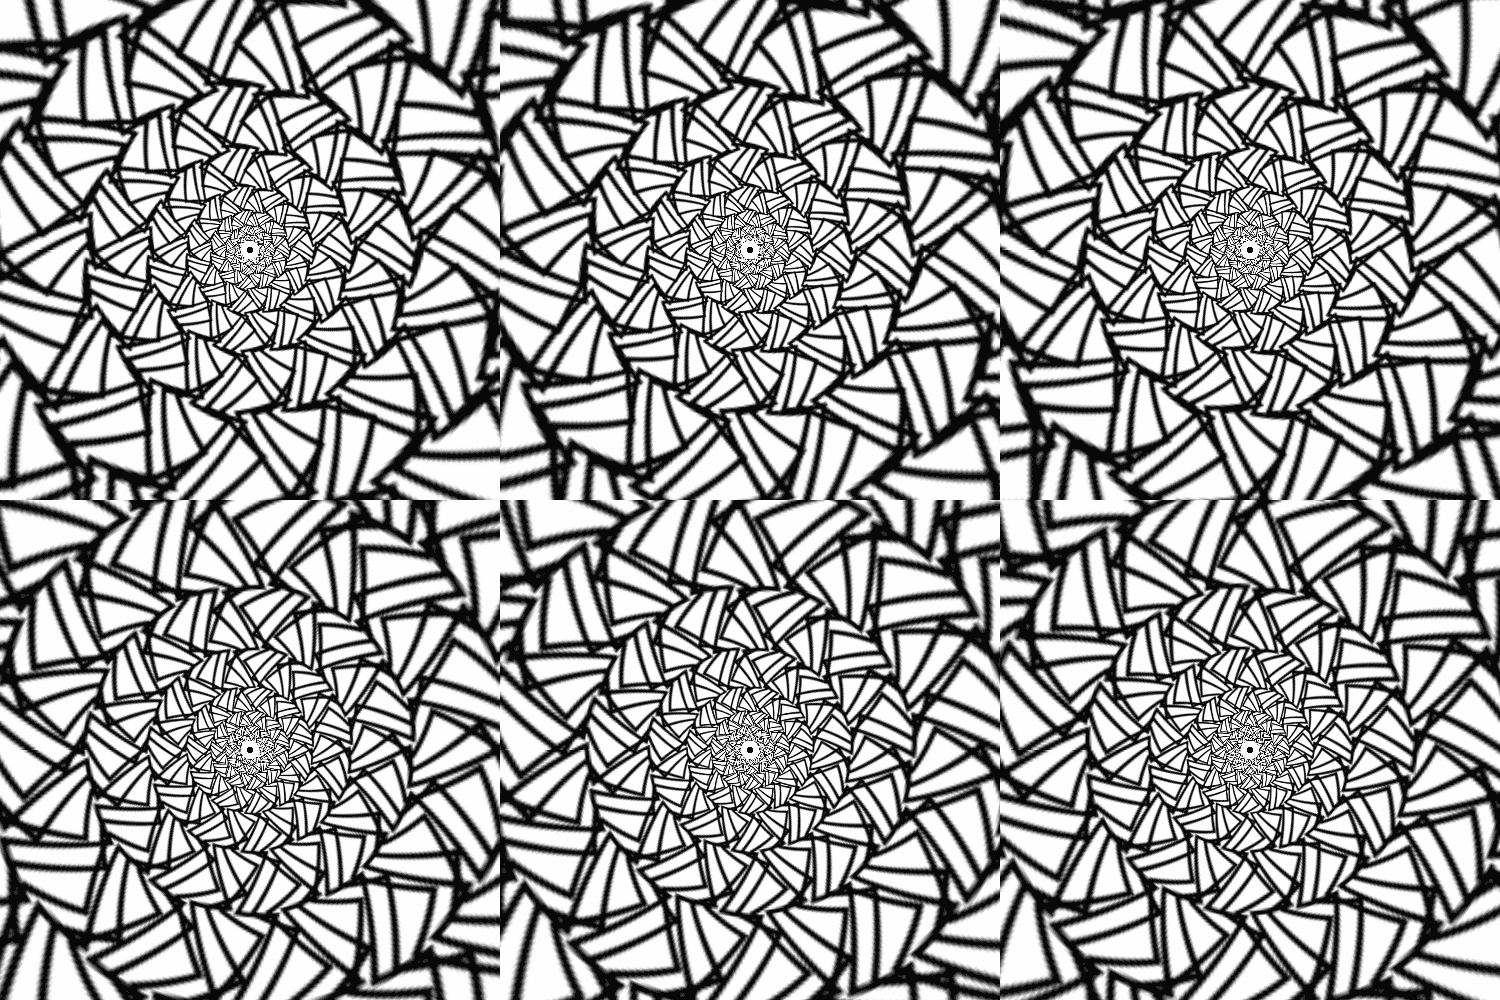
Mathematics has been described as a way of modeling the world, and algebra as its language. It can seem unintelligible at times, particularly when one looks at the more advanced forms and formulae. This GIF from the Archery Tumblr brings home what might otherwise remain obscure and abstract: the effect of altering the wave amplitude (vertical displacement from zero, i.e., the wave’s height) on a given set of log-polar transforms.
Yeah, I took a year of calculus in University and I’m not sure either.
But once you look at the three matching GIFs, all other inputs being equal, you can clearly see exactly the effect this has. It’s rare to find an image that clarifies and brings home to a non-technical audience the effect of a small change in a mathematical formula, but this is one set that does exactly that.
As the amplitude increases, the visual illusion of movement from edge to center breaks up, turning instead into a restless churning of fangs in concentric circles around the center.
The code for that? Via Mathematica:
WfPlot[ s_, t_] :=
Graphics[
Table[
{AbsoluteThickness[1.5],
Line[
Table[
{i + If[Mod[i, 2] == 0, s*Sin[j*2 Pi/66 + i*2 Pi/6 + t], 0],
(-1)^i*.5 + .4*j},
{i, 1, 19}]]},
{j, 1, 69, 1}],
PlotRange -> {{1, 19}, {.8, 27.2}},
ImageSize -> {500, 500}]
LogPolar[x_, y_] := {Log[Sqrt[x^2 + y^2]], ArcTan[x, y]}
Manipulate[
ImageTransformtion[
WfPlot[s, t],
LogPolar[#[[1]], #[[2]]] &, DataRange -> {{-Pi, Pi}, {-Pi, Pi}}],
{s, 0, 1}, {t, 0, 2Pi}]


