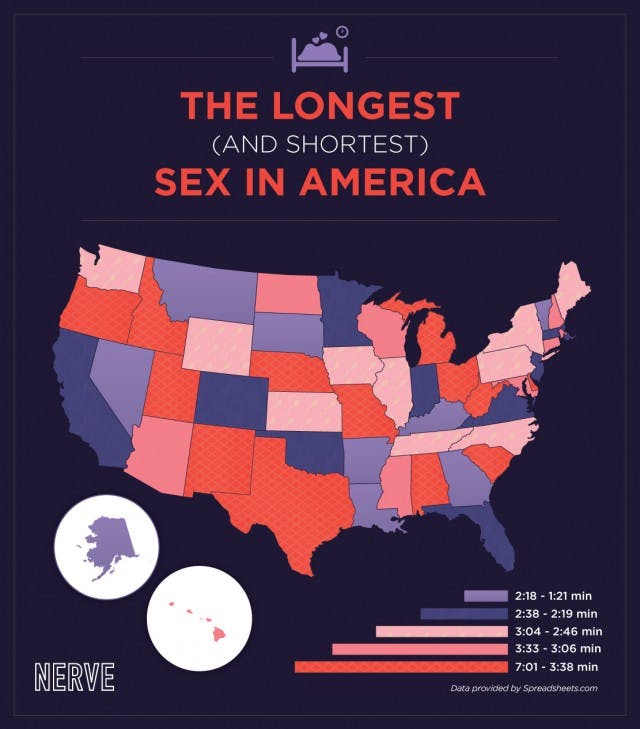
When the sex tracking app Spreadsheets, which tracks your duration, thrusts, and decibel levels during sex, was released last year, it was pretty clear that the only couples who would actually use it were obsessive compulsives and the sorts of type-A yuppies who set aside time for cuddling on their Google calendars (think the Parker Posey/Michael Hitchcock characters from Best In Show).
The good folks at Nerve, however, have figured out how to put Spreadsheets’ freakishly anal retentive “light-hearted and improvement-oriented” approach to sex to good use. They’ve crunched the stats and drawn up a state-by-state breakdown of users’ “sexual endurance” times, or how long they last during sex, so you can find out if the residents of your home state are Energizer Bunnies or Quick Draw McGraws.

According to the map, New Mexico is the longest-lasting state, coming in at 7 minutes and 1 second (must be all that Blue Sky meth), followed by West Virginia (5:38) and Idaho (5:11). Lest conservative males get all excited about these stats and start pointing to them as evidence of red-staters’ superior masculinity, we should note that the states with the shortest endurance times also tend to go red: Alaska and South Dakota, which come in at a paltry 1:21 and 1:30, respectively.
So do these numbers mean that single women should relocate to Albuquerque in droves, or that Alaskan men should start laying off the salmon and pop a few Cialis before bed? Probably not: The stats were culled from only 10,000 early app adopters, so they’re by no means reflective of statewide sexual behaviors.
Nor is a low performance time particularly damning: research shows that most sexual encounters last between only 3 to 13 minutes, and pretty much any woman will tell you that there’s only so much in-and-out a girl can take before her mind starts wandering to if she wants to order Chinese or Mexican for dinner. Still, if you’re the competitive type, you can check out your state’s ranking in the list below.
1. New Mexico—(7:01)
2. West Virginia—(5:38)
3. Idaho—(5:11)
4. South Carolina—(4:48)
5. Missouri—(4:22)
6. Michigan—(4:14)
7. Utah—(3:55)
8. Oregon—(3:51)
9. Nebraska—(3:47)
10. Alabama—(3:38)
11. Delaware—(3:33)
12. Hawaii—(3:28)
13. Wisconsin—(3:22)
14. North Dakota—(3:18)
15. Arizona—(3:17)
16. Maryland—(3:15)
17. Mississippi—(3:10)
18. Rhode Island—(3:09)
19. Connecticut—(3:07)
20. Texas—(3:06)
21. New Hampshire—(3:04)
22. Wyoming—(3:03)
23. New York—(3:01)
24. Pennsylvania—(2:58)
25. Maine—(2:58)
26. Washington—(2:51)
27. Iowa—(2:50)
28. Illinois—(2:49)
29. North Carolina—(2:47)
30. Tennessee—(2:46)
31. Kansas—(2:38)
32. California—(2:38)
33. Massachusetts—(2:31)
34. Florida—(2:29)
35. New Jersey—(2:28)
36. Indiana—(2:26)
37. Virginia—(2:23)
38. Oklahoma—(2:21)
39. Colorado—(2:21)
40. Minnesota—(2:19)
41. Ohio—(2:18)
42. Louisiana—(2:17)
43. Kentucky—(2:14)
44. Arkansas—(2:08)
45. District of Columbia—(2:08)
46. Nevada—(2:07)
47. Georgia—(2:07)
48. Montana—(2:03)
49. Vermont—(1:48)
50. South Dakota—(1:30)
51. Alaska—(1:21)
*Note: Averages vary dependent on state usage.
H/T Nerve | Photo by davidrossharris/Flickr (CC BY 2.0)


