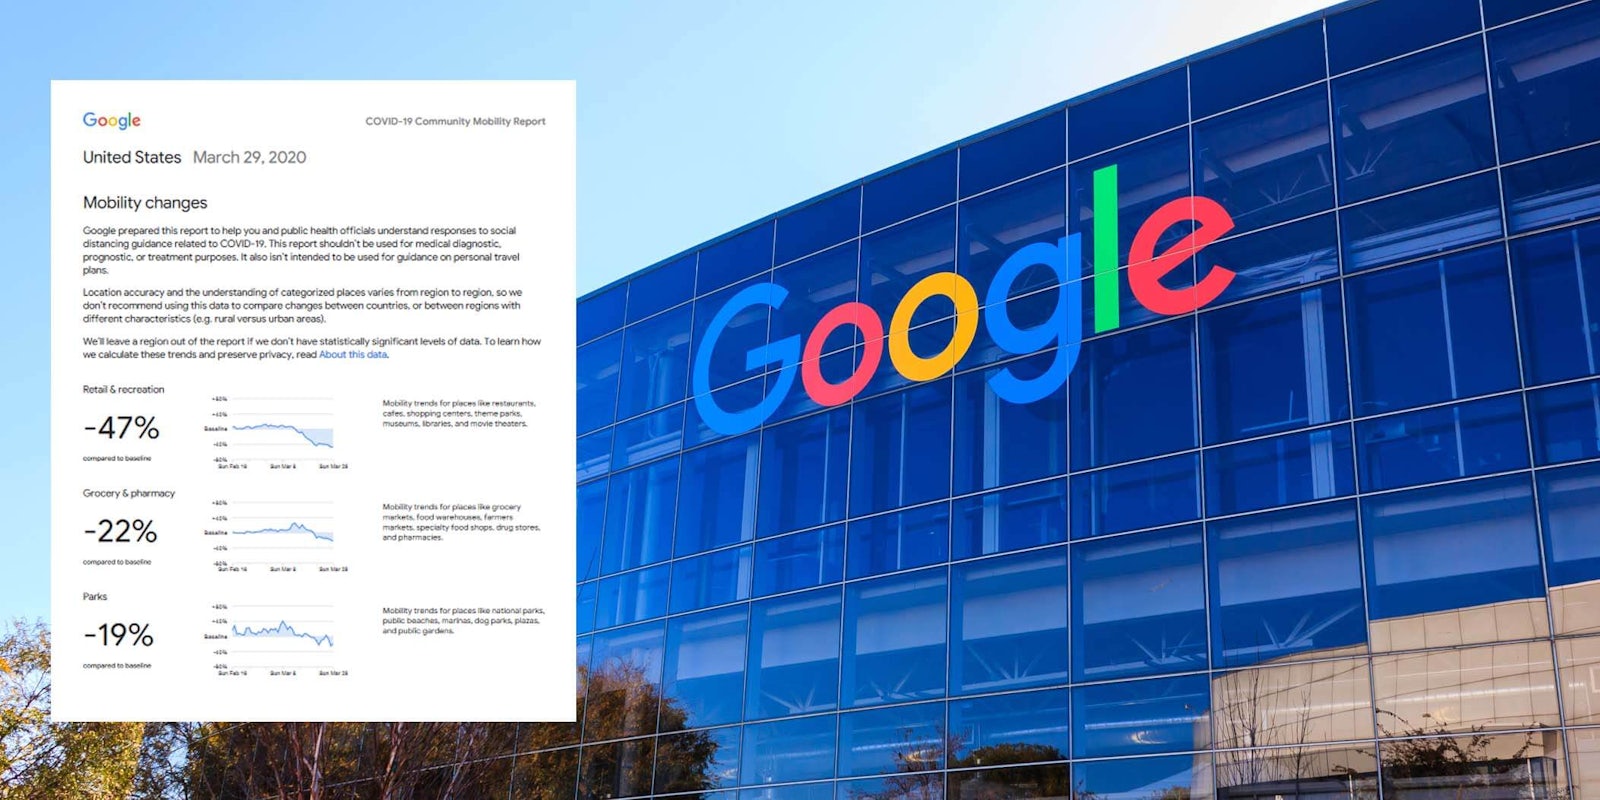
Google launched a new website late Thursday that shows data about how much people are social distancing during the coronavirus emergency.
The data, called “mobility reports,” uses aggregated, anonymized data from Google users who have turned on the location history setting on their devices to show changes in people’s movements at places like retail, grocery stores, parks, mass transit stations, workplaces, and residential.
The reports show a number of different countries, and in the United States it can be drilled down to beyond state level.
According to the data, the mobility trend in the United States for places like restaurants, shopping centers, theme parks, libraries, movie theaters, and museums has dropped 47 percent from the baseline starting in mid-February.
The United States data shows mobility trends for transit stations dropping 51 percent compared to the baseline and 38 percent for workplaces. Residential trends have risen 12 percent from the baseline.
On the state level, people can also view reports for individual counties.
“In addition to other resources public health officials might have, we hope these reports will help support decisions about how to manage the COVID-19 pandemic,” Google wrote in an announcement for the site’s launch. “For example, this information could help officials understand changes in essential trips that can shape recommendations on business hours or inform delivery service offerings.”
The announcement continues:
“Ultimately, understanding not only whether people are traveling, but also trends in destinations, can help officials design guidance to protect public health and essential needs of communities.”
READ MORE:
- When will Google’s testing site be available nationwide? Congress wants to know
- Amazon hides behind ‘worker safety’ to justify firing employee who led strike for ‘worker safety’
- Fever map shows just how well social distancing is working
- Trump admin once claimed coronavirus would be good for jobs—now 10 million are unemployed


