As Larry Wilmore recently stated on The Daily Show, “What a week to be Senior Black Correspondent!”
That was the black comedian and writer’s take when invited on Monday night’s show to discuss the myriad of racially charged stories that have been dominating headlines lately. As someone who specializes in providing biting satire of racial hypocrisies, he could hardly ask for a more bountiful joke mine.
The week began with the U.S. Supreme Court refusing to overturn a Michigan Law prohibiting the consideration of race in college admissions—a ruling that many considered a validation of the belief in a post-racial America. But then came incendiary racial comments from embattled Nevada rancher Cliven Bundy and L.A. Clippers Owner Donald Sterling that were universally deemed hateful and bigoted.
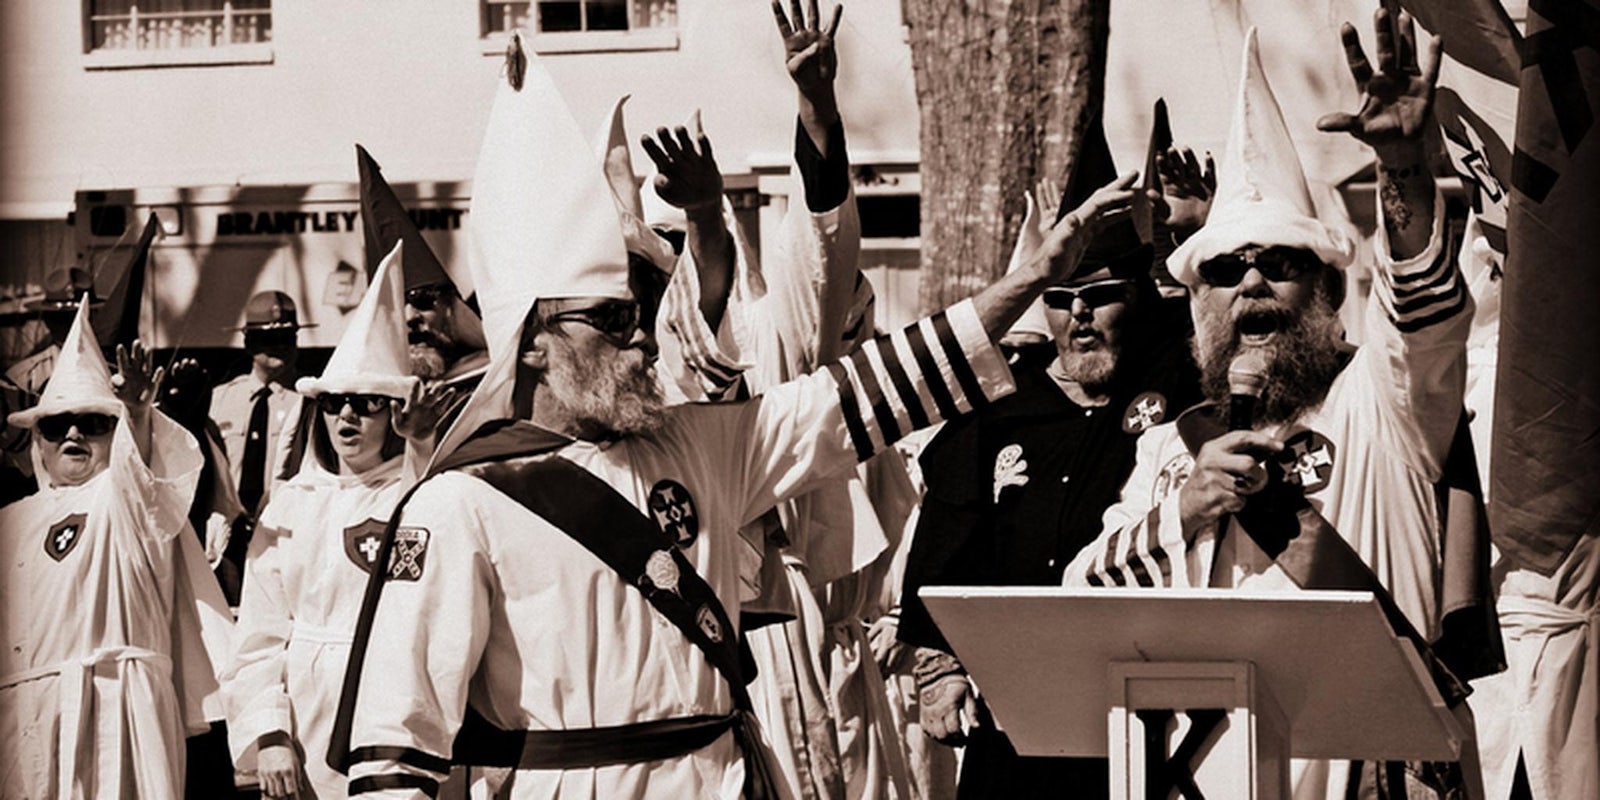
“In one news cycle we’ve got libertarian cowboy racists, old Jewish sports racists, and dudes bragging about their black friends through a KKK hood,” opined Wilmore, “… MWAH!”
Though the official rationale of the Supreme Court’s college admissions decision had more to do with state’s rights under the federal constitution, much of the public debate has been about racism and whether or not it’s over in this country. In many cases, the arguments being made have relied on anecdotal evidence—citing everything from the election of the nation’s first black president to Bundy’s 19th century thinking.
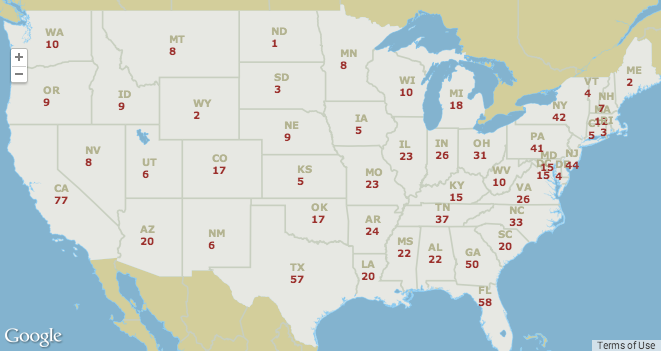
But for years one group has been dedicated to monitoring how much hate exists in the United States. Since the early 1990s, the Southern Poverty Law Center has published an annual Hate Map to show where hate groups operate and track their rising and falling numbers.

Screengrab via the Southern Poverty Law Center
Originally published in print, an interactive version of the map has been online for the past decade. There, you can see how many and what kinds of hate groups are located in your state.
“Almost invariably, people are surprised how many of these groups there are,” said Mark Potok, a senior fellow at the SPLC. “The vast majority are small and unknown even to their neighbors.”
The number of hate groups has been on the rise ever since 2000, Potok told the Daily Dot. The numbers surged following the election of President Barack Obama and the economic downturn in 2008. That year, the total number of hate groups was 888. By 2012 it had risen to 1,007. The numbers fell slightly in 2013 and the SPLC currently counts the number of hate groups nationwide at 939.
The SPLC is deliberative in the way it determines what is or is not an active hate group. Potok says they want to make sure they aren’t counting “just one guy with a website.” To be included on the Hate Map does not necessitate taking part in violent or criminal activity. The SPLC counts hate groups as any active organization that has “beliefs or practices that attack or malign an entire class of people, typically for their immutable characteristics.”
It’s not just chapters of the Klu Klux Klan. The SPLC also includes black separatist groups, anti-gay groups, and anti-Muslim groups, among others.
The state with the most hate groups may come as a surprise to most. California is often characterized as a liberal, progressive haven, but its large and diverse population is probably why it has 77 known hate groups currently in operation—more than any other state.
Other states with a high number of hate groups include Florida (58), Texas (57), Georgia (50), New Jersey (44), New York (42), and Pennsylvania (41). Throughout the southern and Midwestern states, the number of hate groups typically numbered in the 20s or 30s. In the upper plans, many states had fewer than 10 hate groups. The only state without any hate groups was Hawaii.
Though the map is presented as a broad and open-ended resource for community groups, law enforcement officials and academic researchers, Potok said one thing is for certain: the hate map proves that racism is alive and well in the United States.
“The idea that we live in a post-racial America is ludicrous, and our map is incontrovertible proof of that fact,” he said.
Photo by Craig O’Neal/Flickr (CC BY 2.0)


