For those of us who have spent countless hours on Wikipedia clicking through every related link or article, Histography is a treasure.
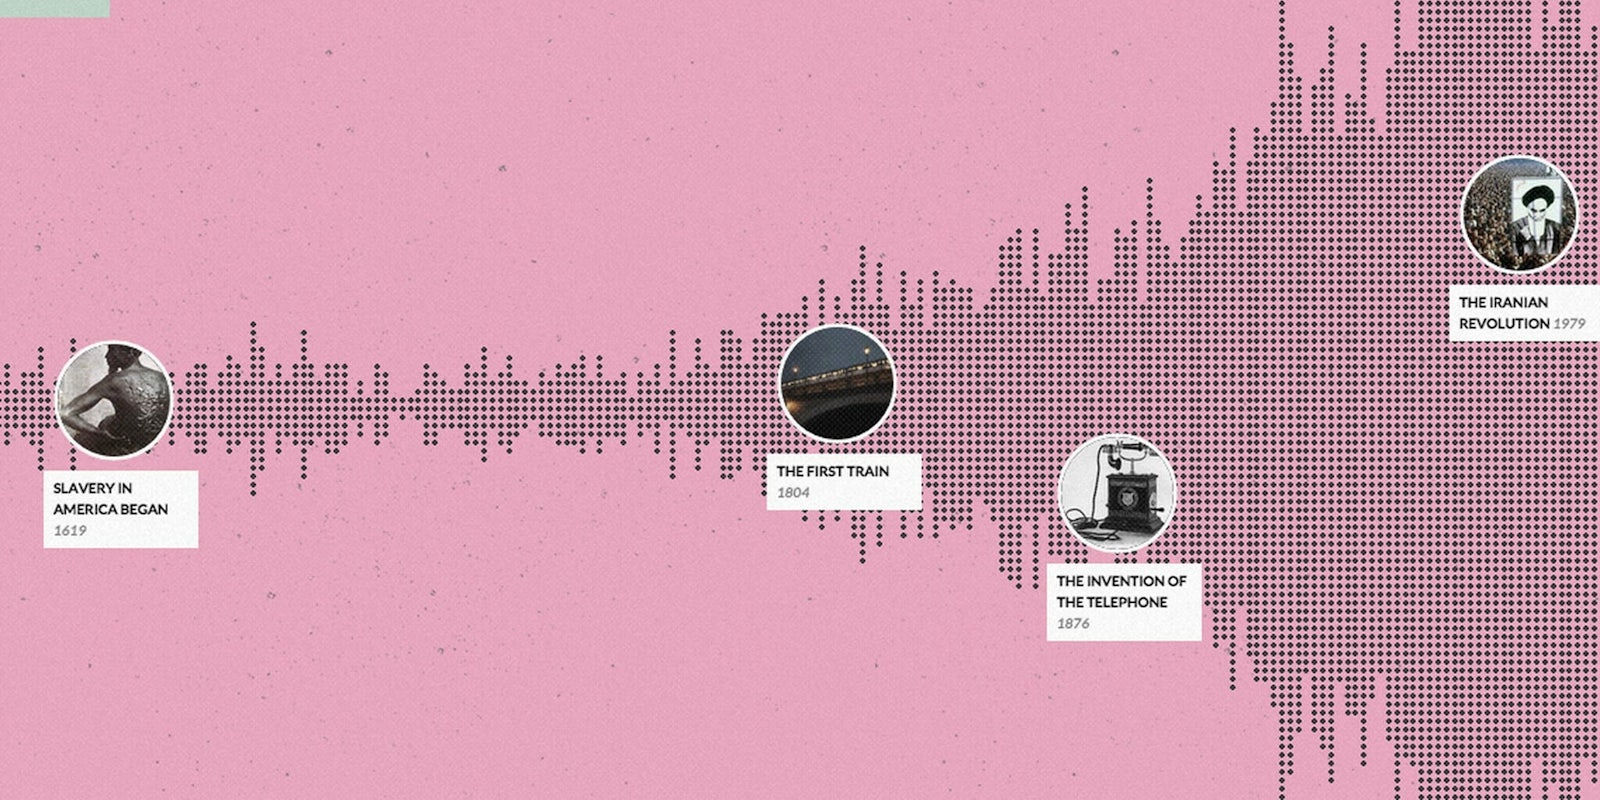
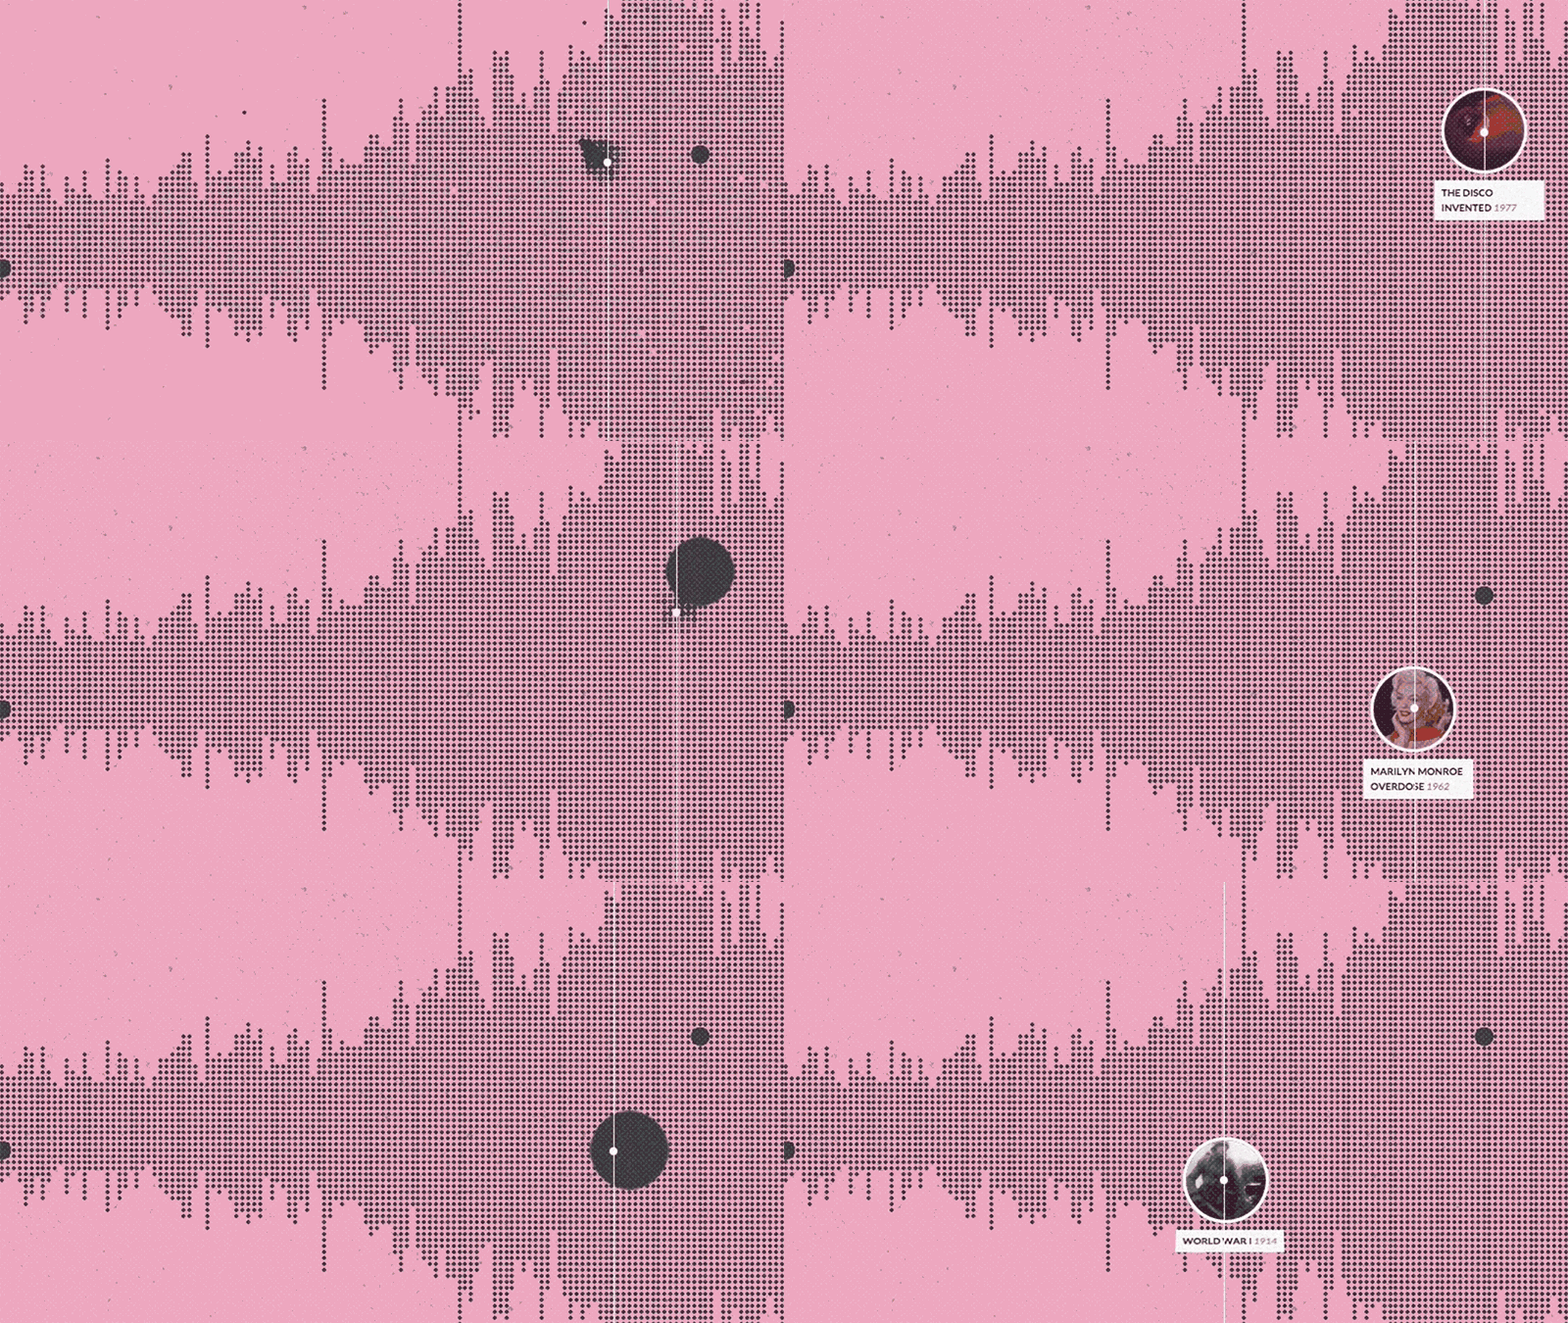
Histography takes you through millennia worth of Wikipedia articles in a beautiful interactive timeline. It includes 14 billion years of history, from the Big Bang until present day. It’s continuously updated with new articles and events when added to the site. You can find out things like when giraffes began to evolve, or when scientists discovered the first microbes, just by toggling across different black dots.
It’s broken into two different sections, editorial stories and a timeline. You can scroll through the interactive maps and click on an event within the timeline to read more about it. It’s possible to view the entirety of recorded history, or set a specific date range to find out what happened in just the last decade. You can also break it down by event or category like Women’s Rights, Music, and Wars.
Interactive designer Matan Stauber built Histography for his final project at Bezalel Academy of Arts and Design.
Through moving black dots, GIFs that match the article, and a calming melody that plays in the background, it’s easy to get lost in the annals of history, as told through Wikipedia.
Photo via Histography


